COPYRIGHT
61
PENNSVALLEY
Lesson 32: (Cont.)
Climate of Australia
ACTIVITY 3:
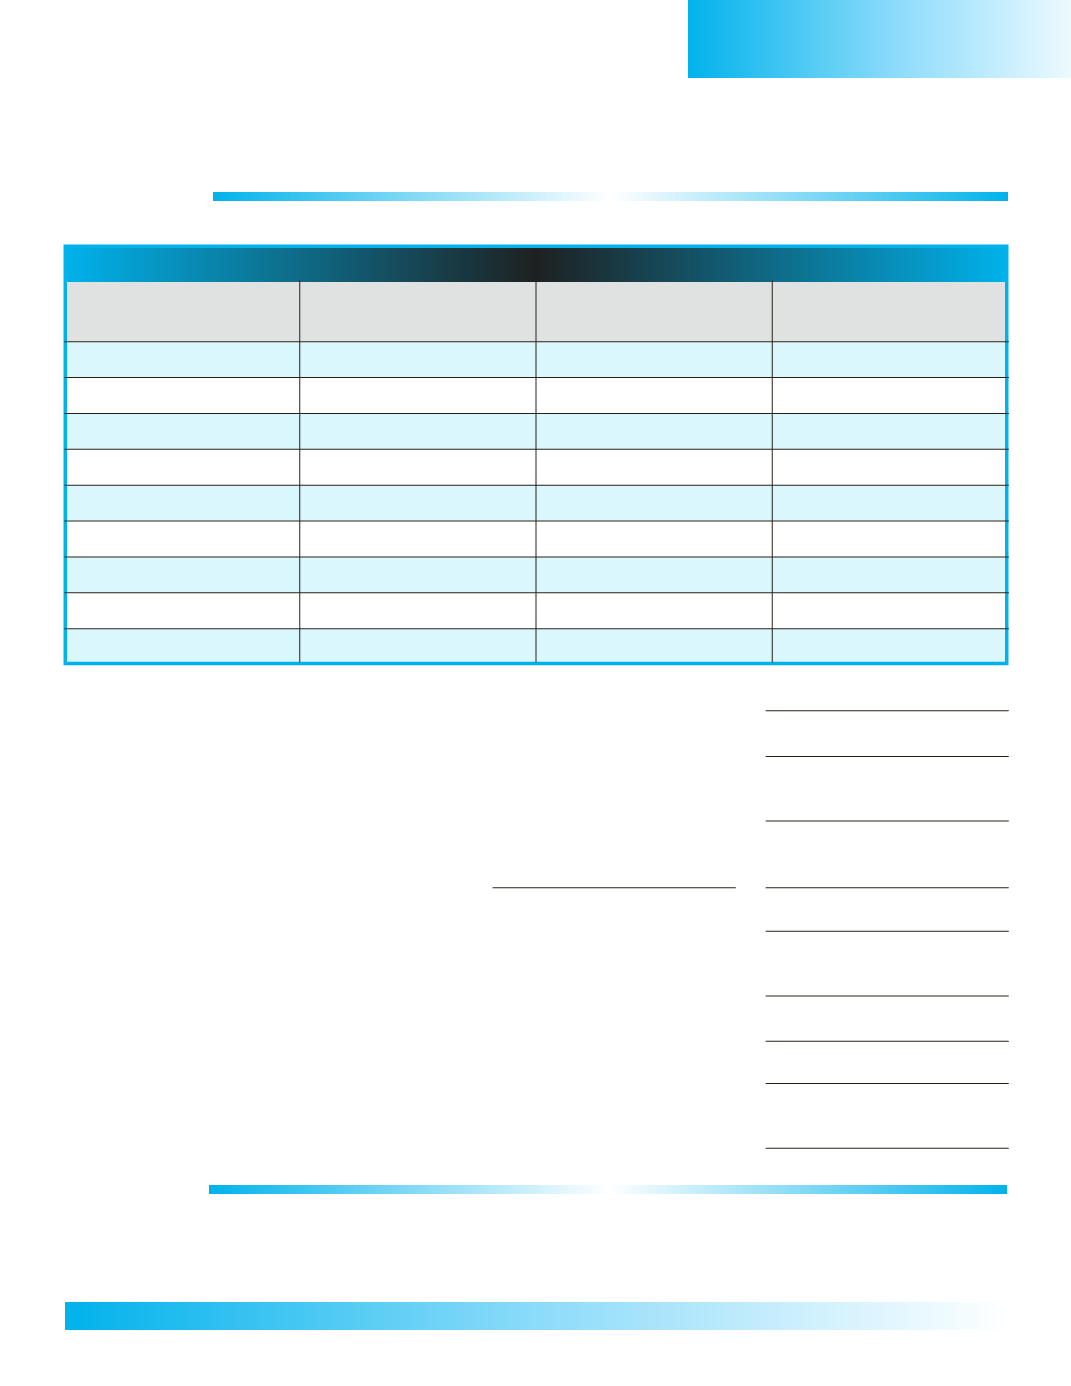
Use the information in the chart below to answer the following questions.
Average Rainfall and Temperatures of Major Australian Cities
City
AverageRainfall
Average January
Average July
PerYear
Temp.
Temperature
Cairns
86”
83°
70°
Brisbane
45”
77°
59°
Sydney
47”
70°
54°
Melbourne
67”
67°
49°
Hobart
25”
62°
46°
Adelaide
20”
72°
52°
Darwin
60”
83°
76°
Perth
36”
74°
55°
AliceSprings
12”
82°
52°
1.Which city receives the
least
amount of rainfall per year?
2.Which city receives the
most
amount of rainfall per year?
3.What is the difference between the least andmost rainfall
these two cities receive?
4. Identify the two cities that receive the
highest
average
January temperature.
5. Identify the city that receives the
lowest
average January temperature.
6.What is the difference between the highest and lowest
average January temperature?
7. Identify the city that receives the
highest
average July temperature?
8. Identify the city that receives the
lowest
average July temperature?
9.What is the difference between the highest and lowest
average June temperature?
ACTIVITY 4:
Make three bar or line graphs about themajor cities of Australia.One graph should be on the average
rainfall, another one should deal with the average summer temperatures, and the third one should
contain averagewinter temperatures.
Australia


